Drawing Water
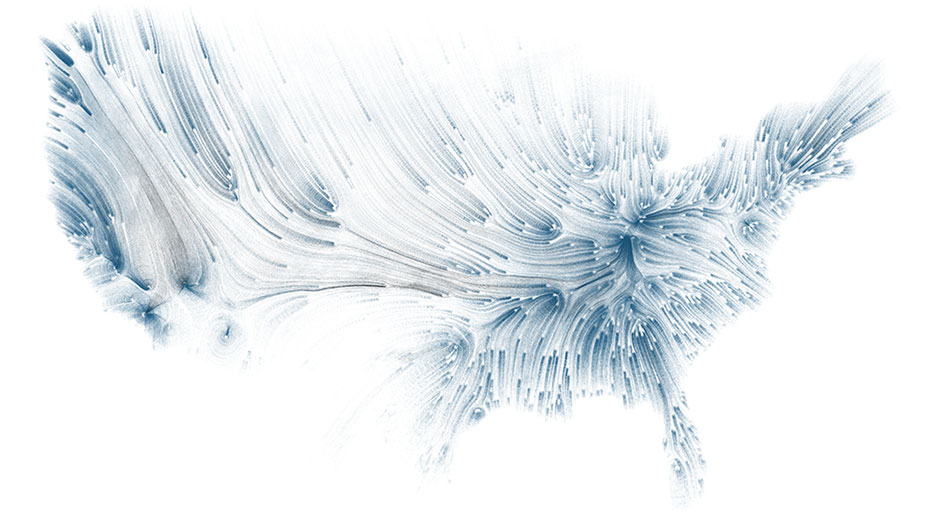
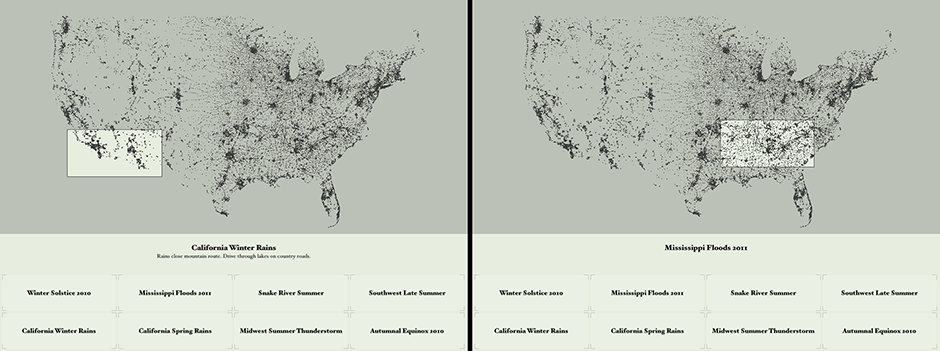
Winter 2011 rainfall versus consumption.
Drawing Water is a constructed landscape shaped by the relationship between where water falls and where it is consumed within the United States. It builds images to expose the reality that water is channeled, pumped, and siphoned to locations far from where it falls. Although the paths are imagined, Drawing Water is based on real data and it reveals a clear truth about water resources and use.
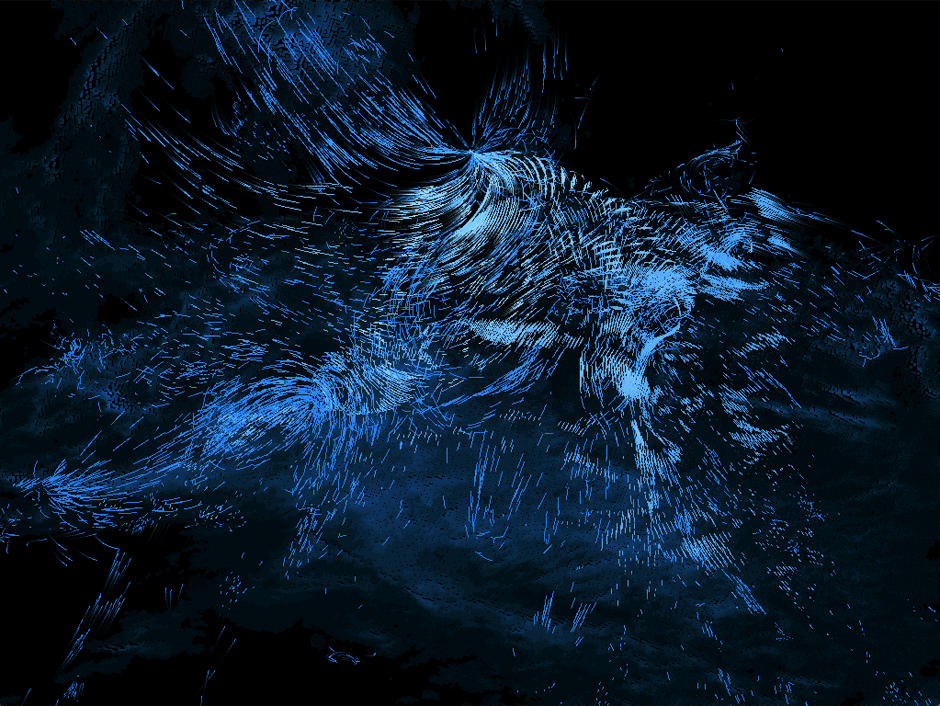
Realtime projection view (Midwest).
Touch interface for navigation.
The project is realized as a series of high-resolution print images as well as an interactive, animated map. Each line in Drawing Water corresponds to a daily rainfall measurement. The length of the line and its initial placement are determined by the amount of rainfall measured and where it fell. The final placement and color of each line are determined by the influence of urban water consumers. The more water a city uses, the stronger its pull on the rainfall. As rainfall is pulled farther from where it fell, it becomes desaturated, turning from blue to black in print and to white in the projected installation.
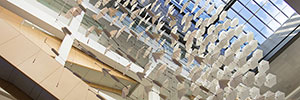
Gallery installation video.
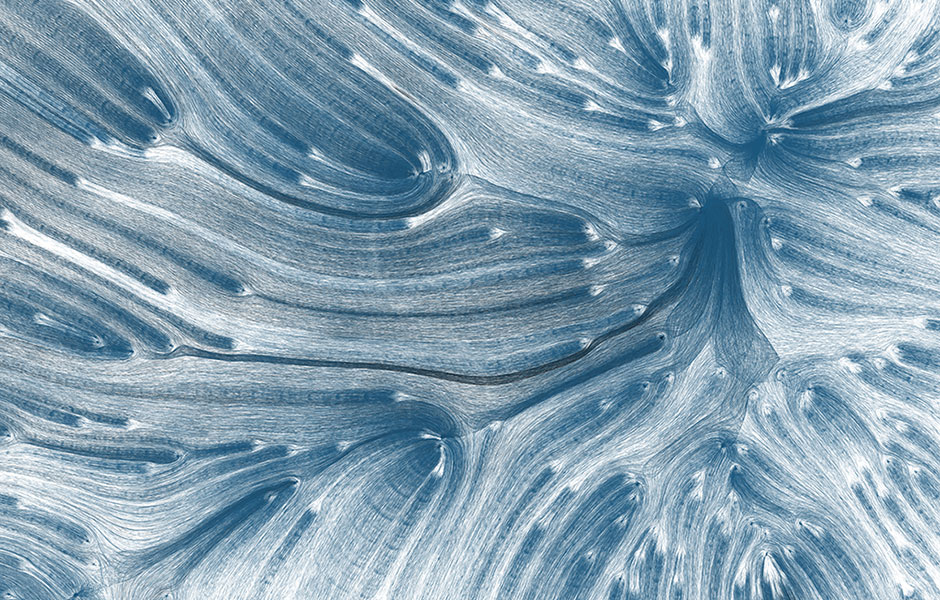
Spring 2011 detail (Midwest)
Water consumption data comes from the USGS and rainfall data is from the NOAA/NWS. After downloading and parsing the data with a series of python scripts, I wrote all the visual software for Drawing Water on top of Cinder.